Awaiting EIA feed
FTG Energy 洞察
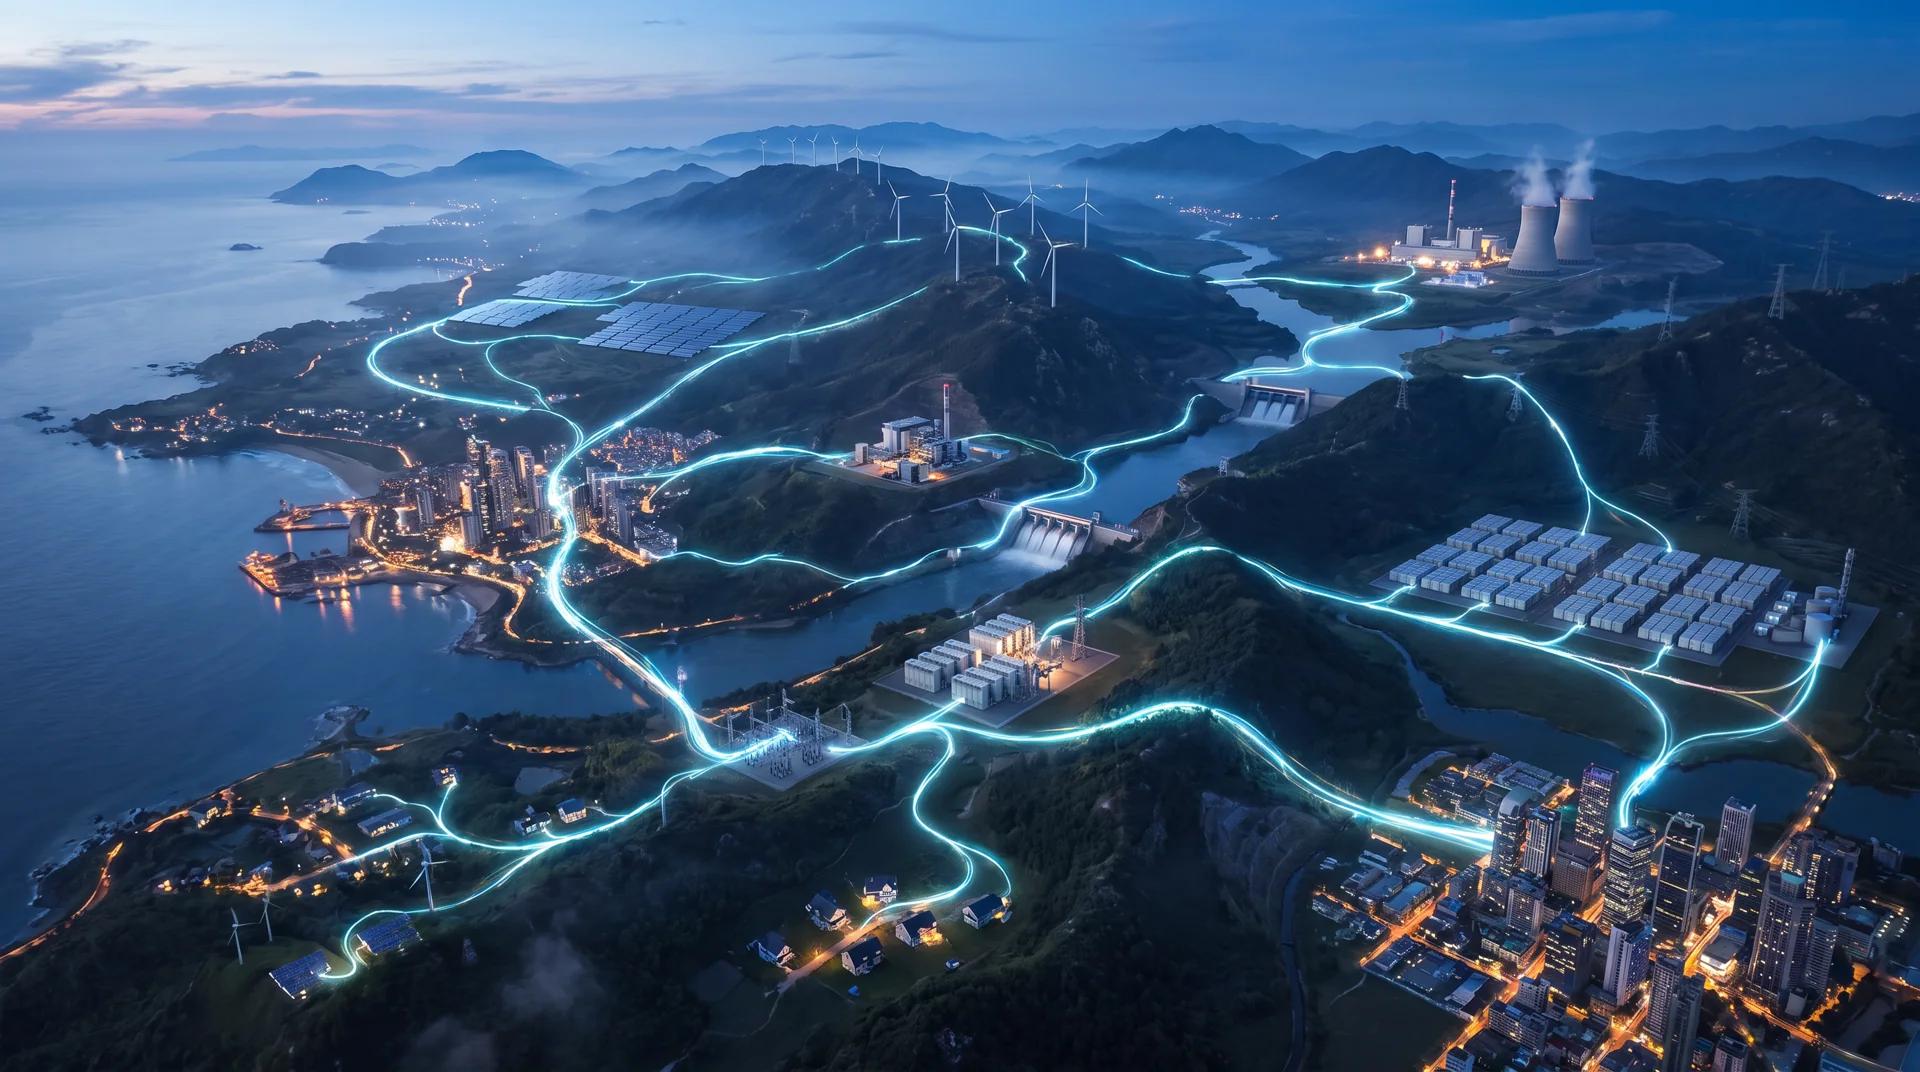
能源系统始终在流动。智能揭示 在哪里。
查看电网实时负荷、碳强度与发电情况,以及塑造能源可及性、价格与能源转型的全球格局。所有当前读数均带时间戳。每个参考值都有日期标注。不会凭空编造任何内容来让仪表板显得“活跃”。
电流信号美国 + 英国电网
全球背景世界银行 + Ember
市场参考30 个精选国家
视觉系统真正的 3D WebGL
Current energy pulse
Four data streams. One global view.
Connecting to verified sources
Awaiting NESO feed
World Bank · —
Global mix · —
Live · United States grid
Source unavailableDemand and generation now
The EIA feed is temporarily unavailable. No zero value is substituted.
Source: U.S. Energy Information Administration · Hourly Electric Grid Monitor.
Live · Great Britain grid
Source unavailableCarbon and generation now
The NESO feed is temporarily unavailable. No zero value is substituted.
Source: National Energy System Operator Carbon Intensity API · CC BY 4.0.
Global intelligence · made spatial
Do not just read the data. Move through it.
This is real perspective geometry—not a flat canvas effect. Thirty featured markets occupy a three-dimensional field whose color, elevation and form respond to the selected energy metric.
True 3D · WebGLGlobal fieldThirty featured energy markets positioned on a true three-dimensional world field.
USA · United States$0.184Residential price · USD/kWh
Global market reference layer: pricing Q4 2025; carbon and generation mix 2024. The values are dated reference data from the established NFluxion Energy Dashboard contract—not simulated live readings.
The human-scale system
Energy intelligence begins with what energy makes possible.
Live grid readings describe the present moment. Global indicators reveal the larger system: who has electricity, how much the world uses, and how generation sources are changing.
World Bank · latest available value · —
World Bank · latest available value · —
World Bank · latest available value · —
—global mix
Global generation mix · latest available
One grid planet. Many generation realities.
Source: Ember / Our World in Data · annual global electricity generation mix. Percentages may total 99.9% or 100.1% because source values are rounded.
Global market reference
Compare the energy world country by country.
30 featured marketsResidential price · USD/kWhQ4 2025 / 2024 reference
Egypt
$0.04512% renewable · 88% fossilSaudi Arabia
$0.0524% renewable · 96% fossilRussia
$0.06621% renewable · 59% fossilTurkey
$0.06744% renewable · 56% fossilChina
$0.07631% renewable · 64% fossilIndia
$0.07722% renewable · 75% fossilUnited Arab Emirates
$0.08010% renewable · 90% fossilArgentina
$0.08036% renewable · 57% fossilIndonesia
$0.09115% renewable · 85% fossilMexico
$0.10725% renewable · 73% fossilCanada
$0.12366% renewable · 19% fossilSouth Korea
$0.12610% renewable · 60% fossilNorway
$0.15892% renewable · 8% fossilBrazil
$0.16184% renewable · 14% fossilUnited States
$0.18422% renewable · 59% fossilSouth Africa
$0.1988% renewable · 87% fossilNew Zealand
$0.20782% renewable · 18% fossilKenya
$0.22090% renewable · 10% fossilJapan
$0.22923% renewable · 69% fossilPoland
$0.23324% renewable · 76% fossilSweden
$0.23660% renewable · 11% fossilSpain
$0.25057% renewable · 21% fossilAustralia
$0.25635% renewable · 65% fossilFrance
$0.27726% renewable · 3% fossilNetherlands
$0.28435% renewable · 61% fossilDenmark
$0.36473% renewable · 27% fossilSwitzerland
$0.36662% renewable · 2% fossilUnited Kingdom
$0.40142% renewable · 43% fossilGermany
$0.40457% renewable · 37% fossilItaly
$0.41743% renewable · 57% fossilTransparent by design
Every number has a source and a time.
Current readings and annual reference datasets are intentionally separated. If a live source fails, FTG shows it as unavailable rather than inventing a value.